Food & Wealth
“Tell me what you eat and I'll tell you what you are.”

Introduction
Rising rates of obesity in industrialized societies have been blamed on an increased consumption of foods having high percentages of refined sugar and fat. Minorities and the poor are at a disadvantage when it comes to the adoption of healthier eating habits. Moreover, low-income neighborhoods have been observed to attract more fast-food outlets and convenience stores as opposed to full-service supermarkets and grocery stores. Even though healthier and more nutritious food options may be present as purchasing choices, their cost is often significantly higher and might be prohibitive for working class people. The rapid rise in food prices has hence helped demonstrate that healthier diets are no longer merely a matter of choice.
In this article, we aim at quantifying the healthiness of food items available in France, as well as exploring the links between the healthiness of the available food items and the socio-economic level according to different subdivisions of the French territory.
Food quality
How can we combine nutritional values in order to acquire a metric that indicates the obesogenic level of each food item?
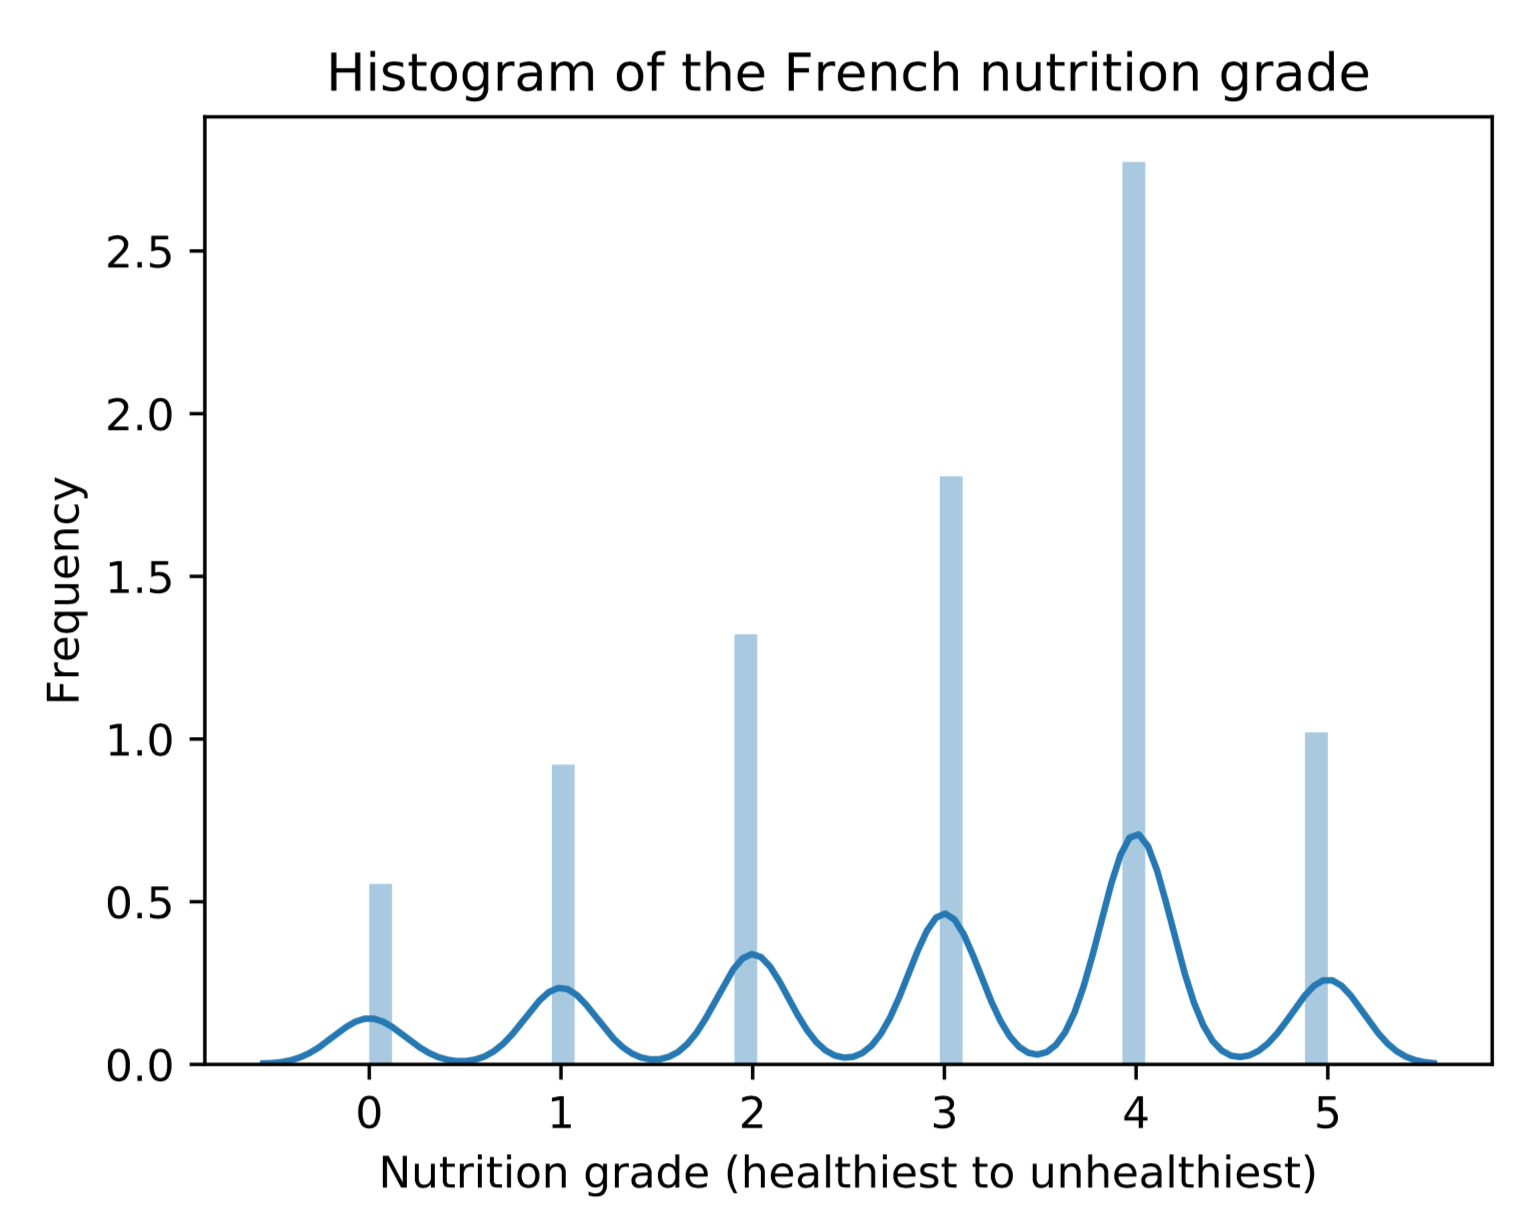
Food grading involves the assessment of various foods regarding quality. Four different nutrition scores for each food item were exploited for our analysis: the nutrition score, the nutrition grade, the calorie density (kcal per serving) and the calorie deviation.
Socio-economic level and geographic characteristics
What criteria should be used to separate the regions with different socio-economic environments ?
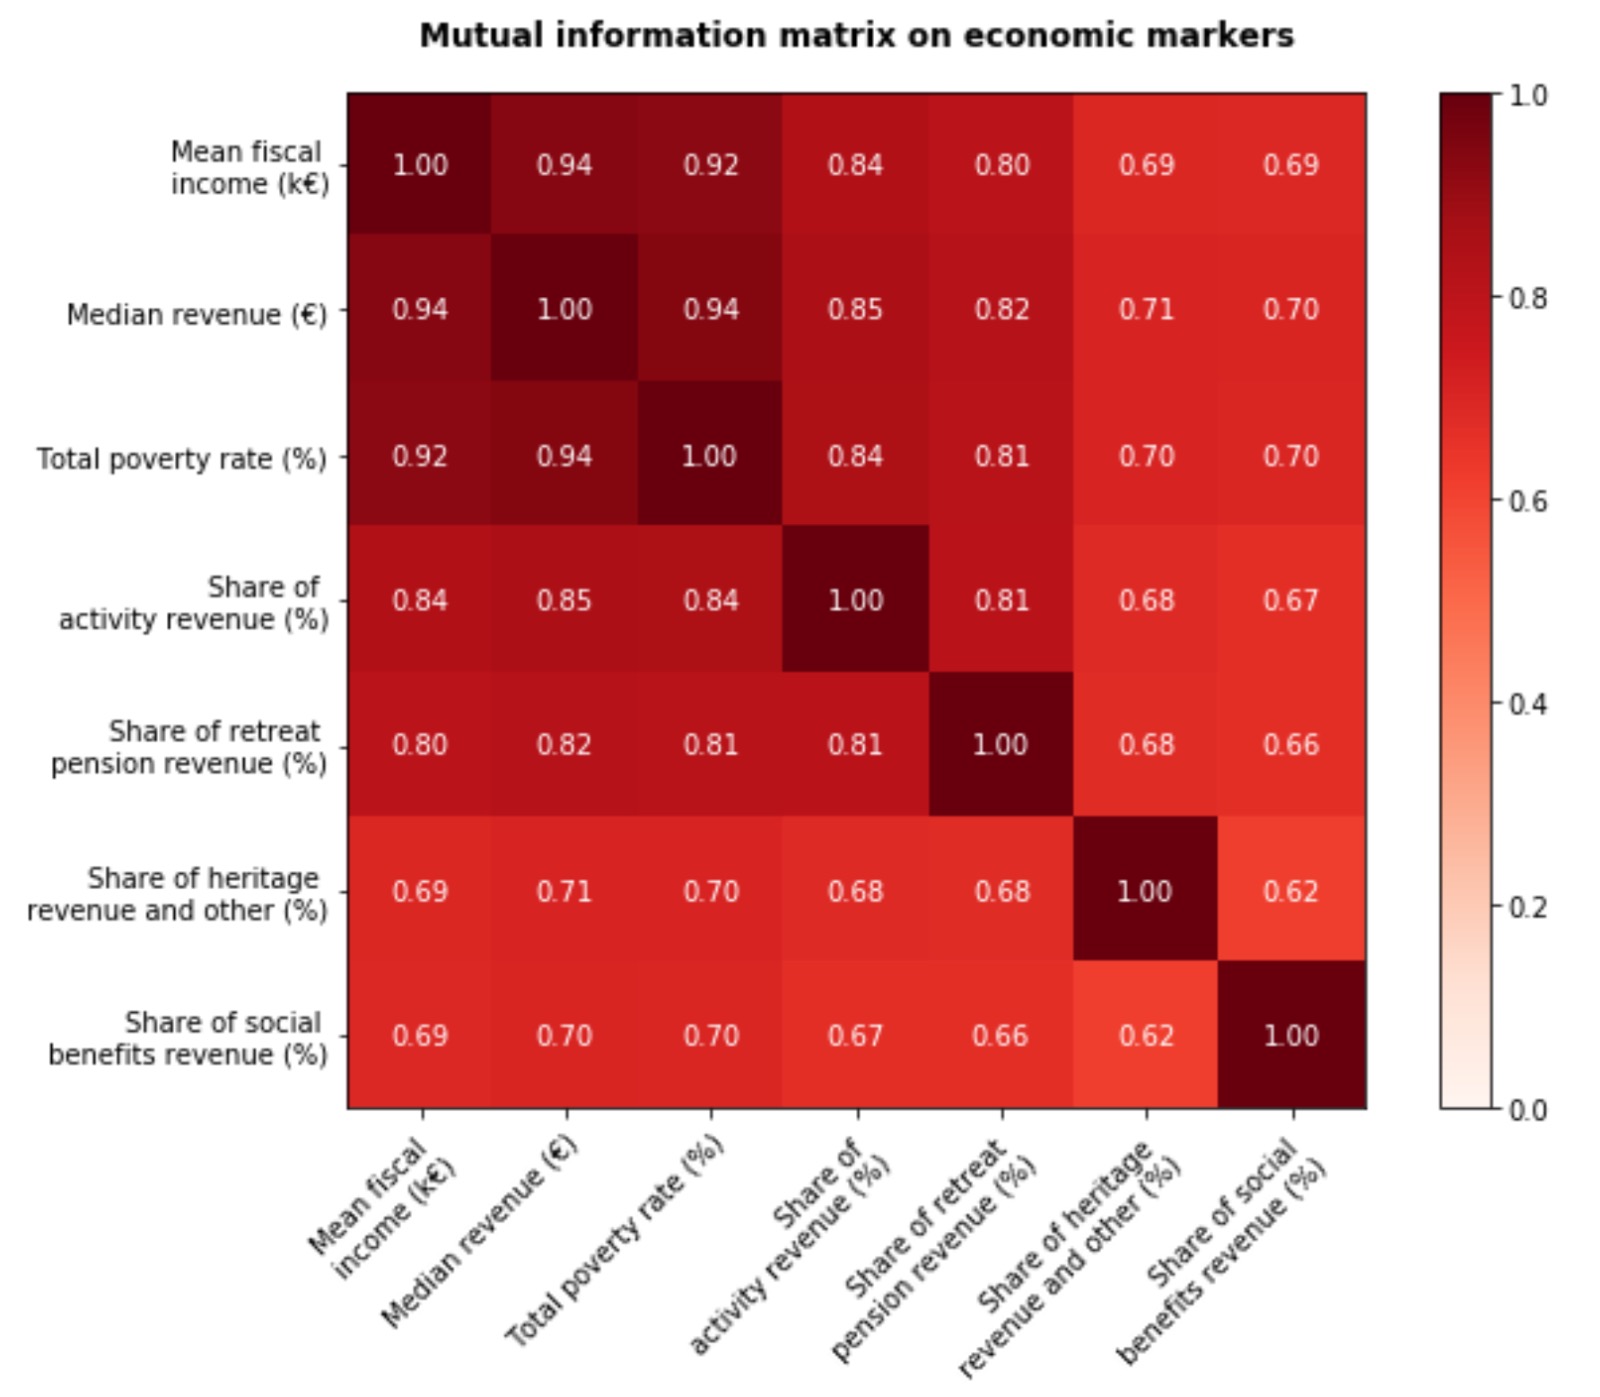
In order to measure poverty, several methods are usually applied. Firstly, comparing the median revenue of different subdivisions of a territory allows the identification of poorer areas. This can be done by using the average revenue as well, although this last indicator is prone to misrepresent the economic level of the area since it can be increased by a few wealthy inhabitants. Additionally, one can use the poverty rate, which describes the percentage of people whose revenue is below 60% of the median revenue. Finally, a third indicator can be based on the inhabitants’ source of income. The sources are namely professional activity, social aid, patrimony and retirement pension.
Spectral clustering
Are the healthier food items associated with higher revenues?
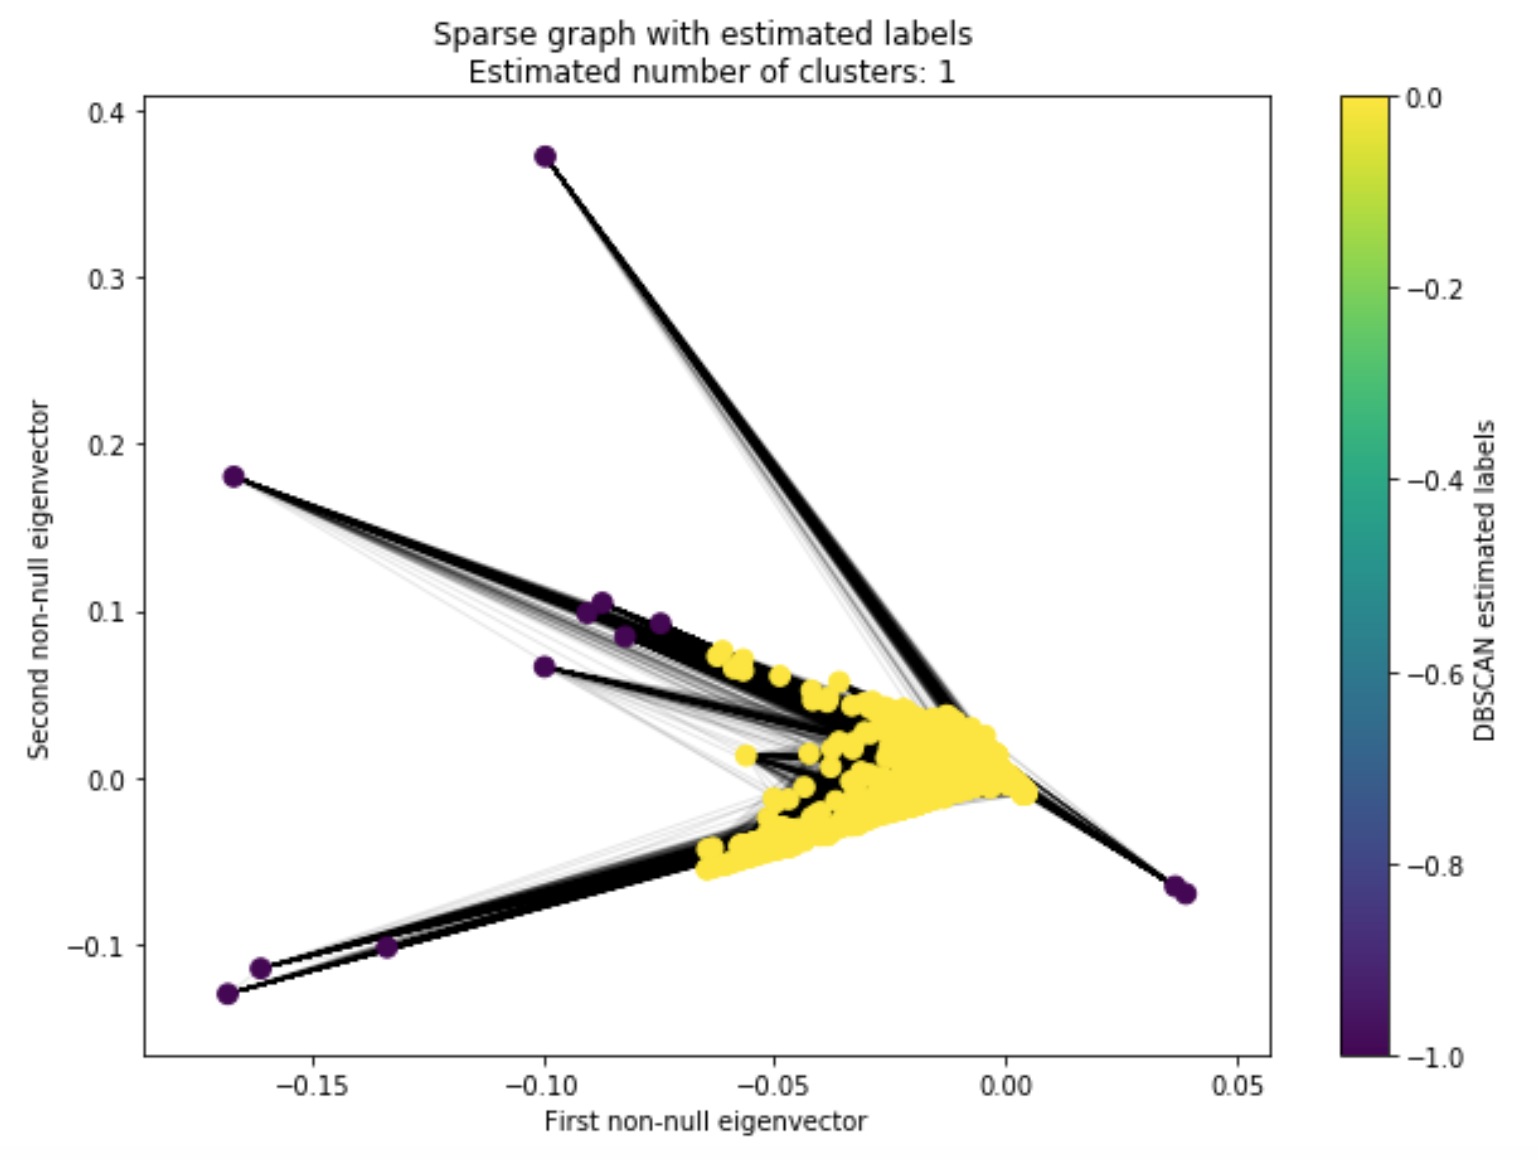
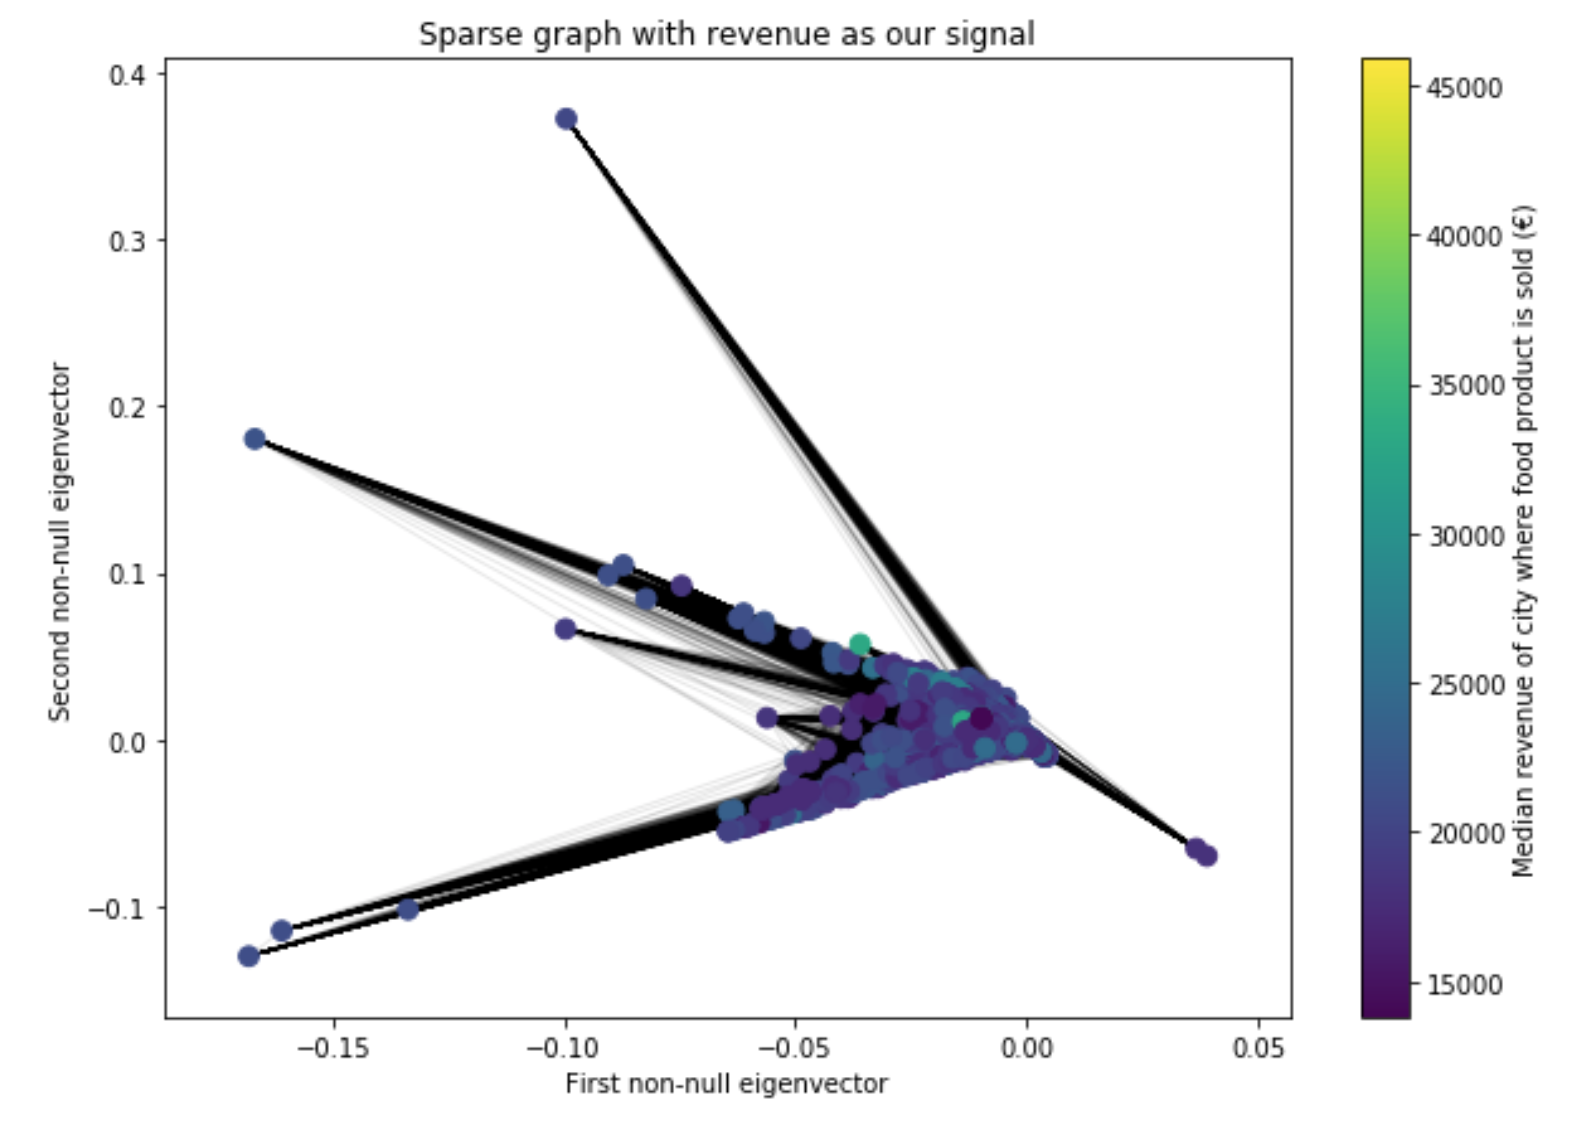
In order to check if there are existing clusters in our dataset, we visualize our data as a graph. The graph’s nodes are considered to be each food item, and the edges are the nutritional similarity between those nodes (nutritional grade, sugar, fat, protein content and so on). The edge similarity is computed only with the nutritional features. The economic marker (i.e. the median revenue) is left as a label. The aim of this analysis is to check if products are clustered by their healthiness. If it is the case, are the healthier clusters associated with higher revenues?
Correlations
What are the links between healthy food availability and socio-economic environment?
The most widespread method of determining the relationship between two variables is the Pearson correlation test. This test was performed at each territorial level between each nutrition feature and the median revenue.
We plotted the correlation tests between the median revenue (€) and each of the nutritional features with their corresponding p-values. We chose the significance level to be at 95%, meaning that a correlation coefficient is only significant if its corresponding p-value is below 0.05. We obtained only a few correlations that were significant at the 95% level.
Geographic visualization
How are the wealth and healthy products geographically distributed in France ?
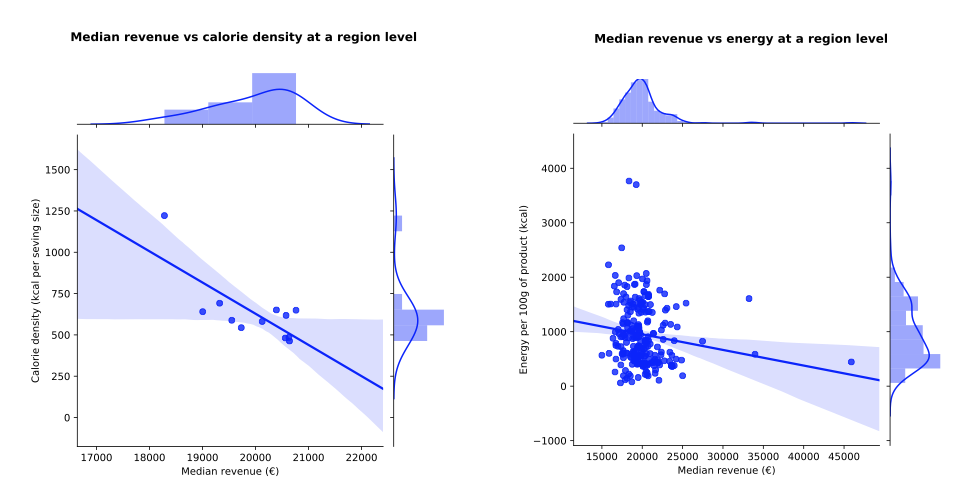
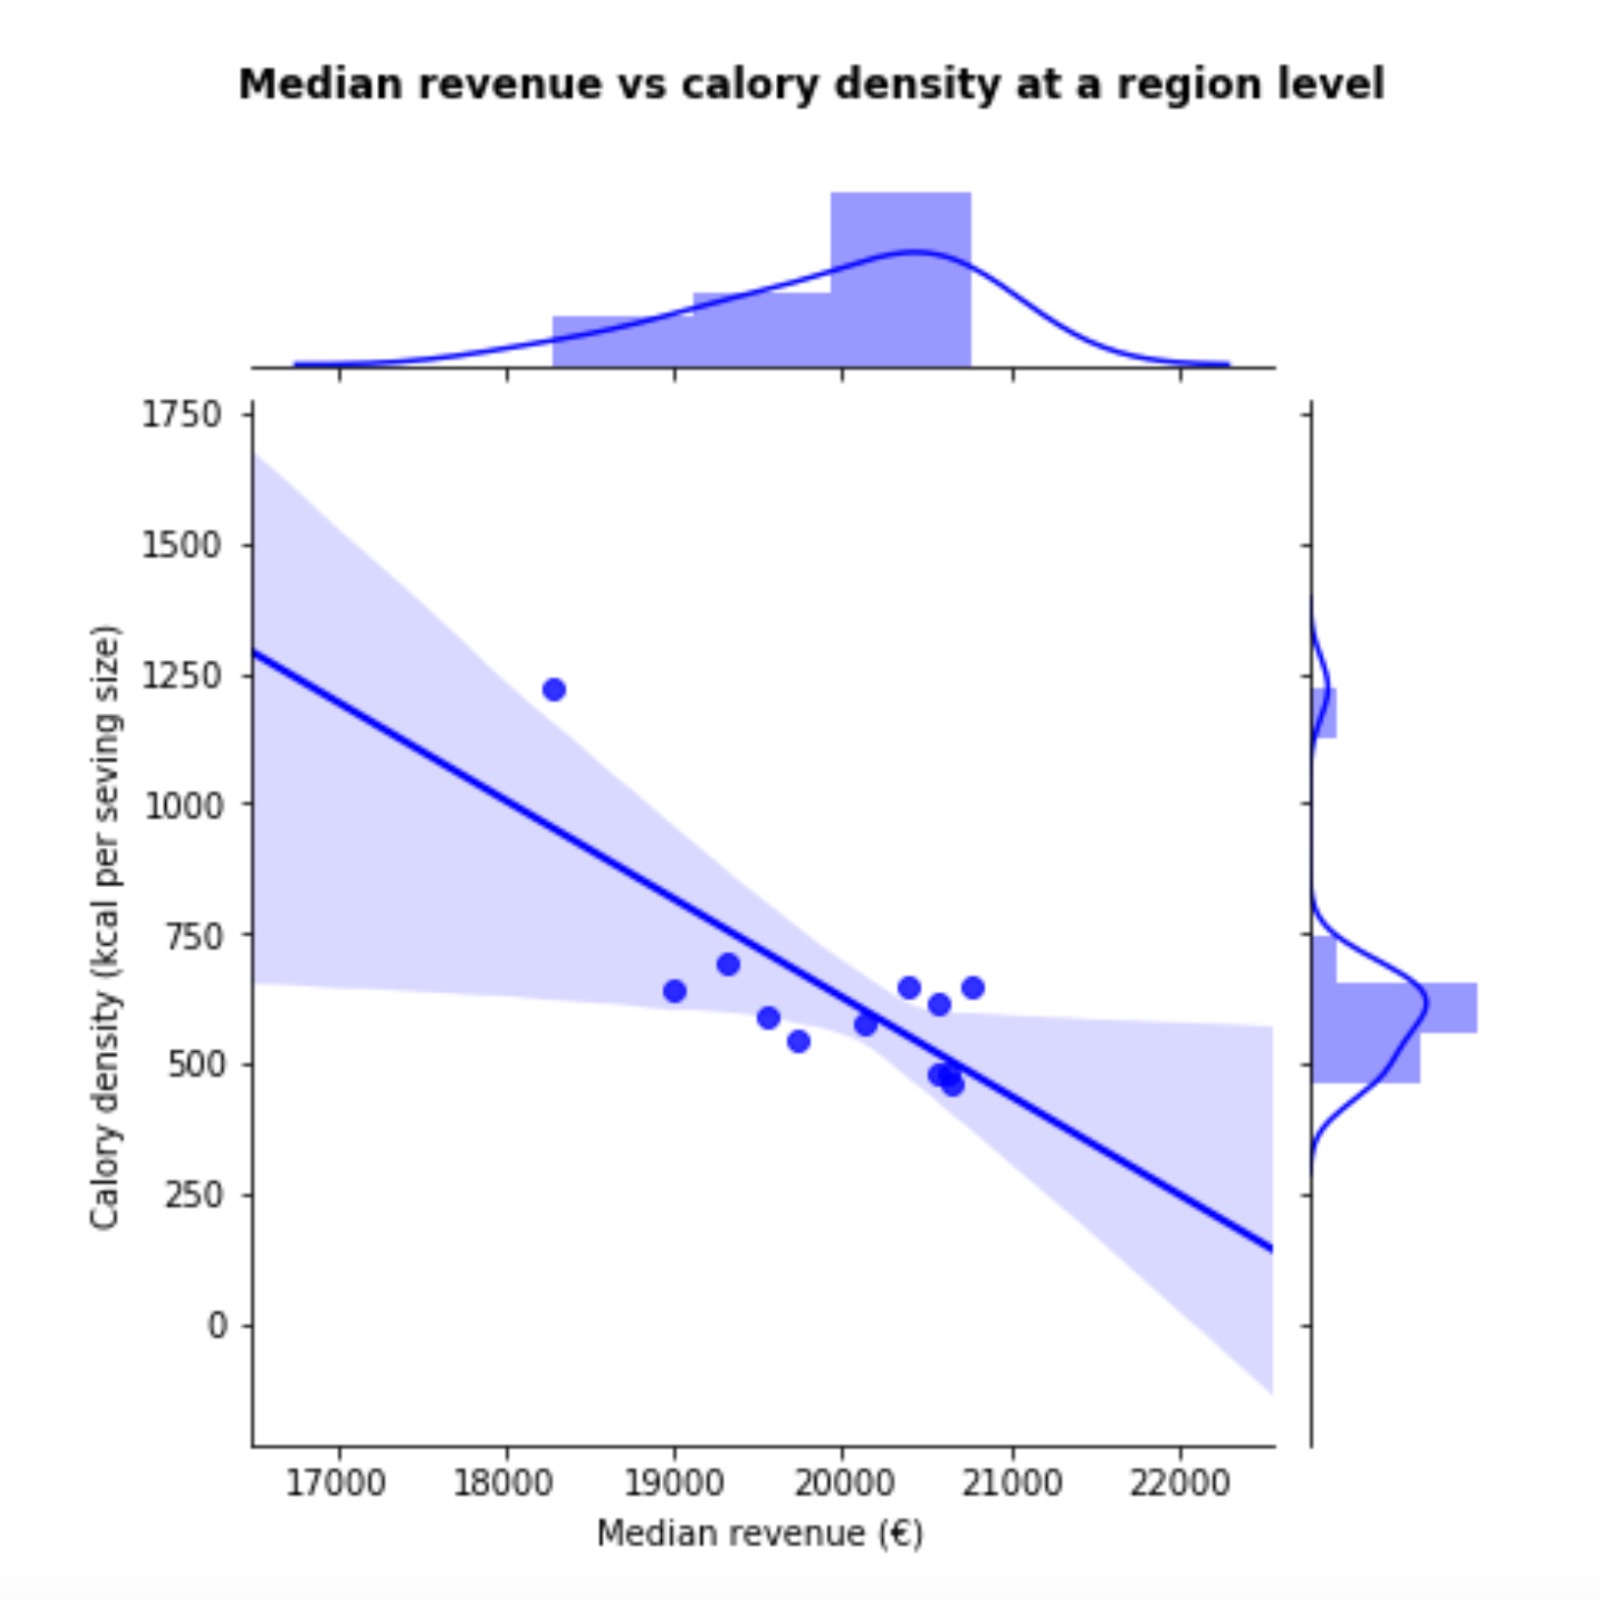
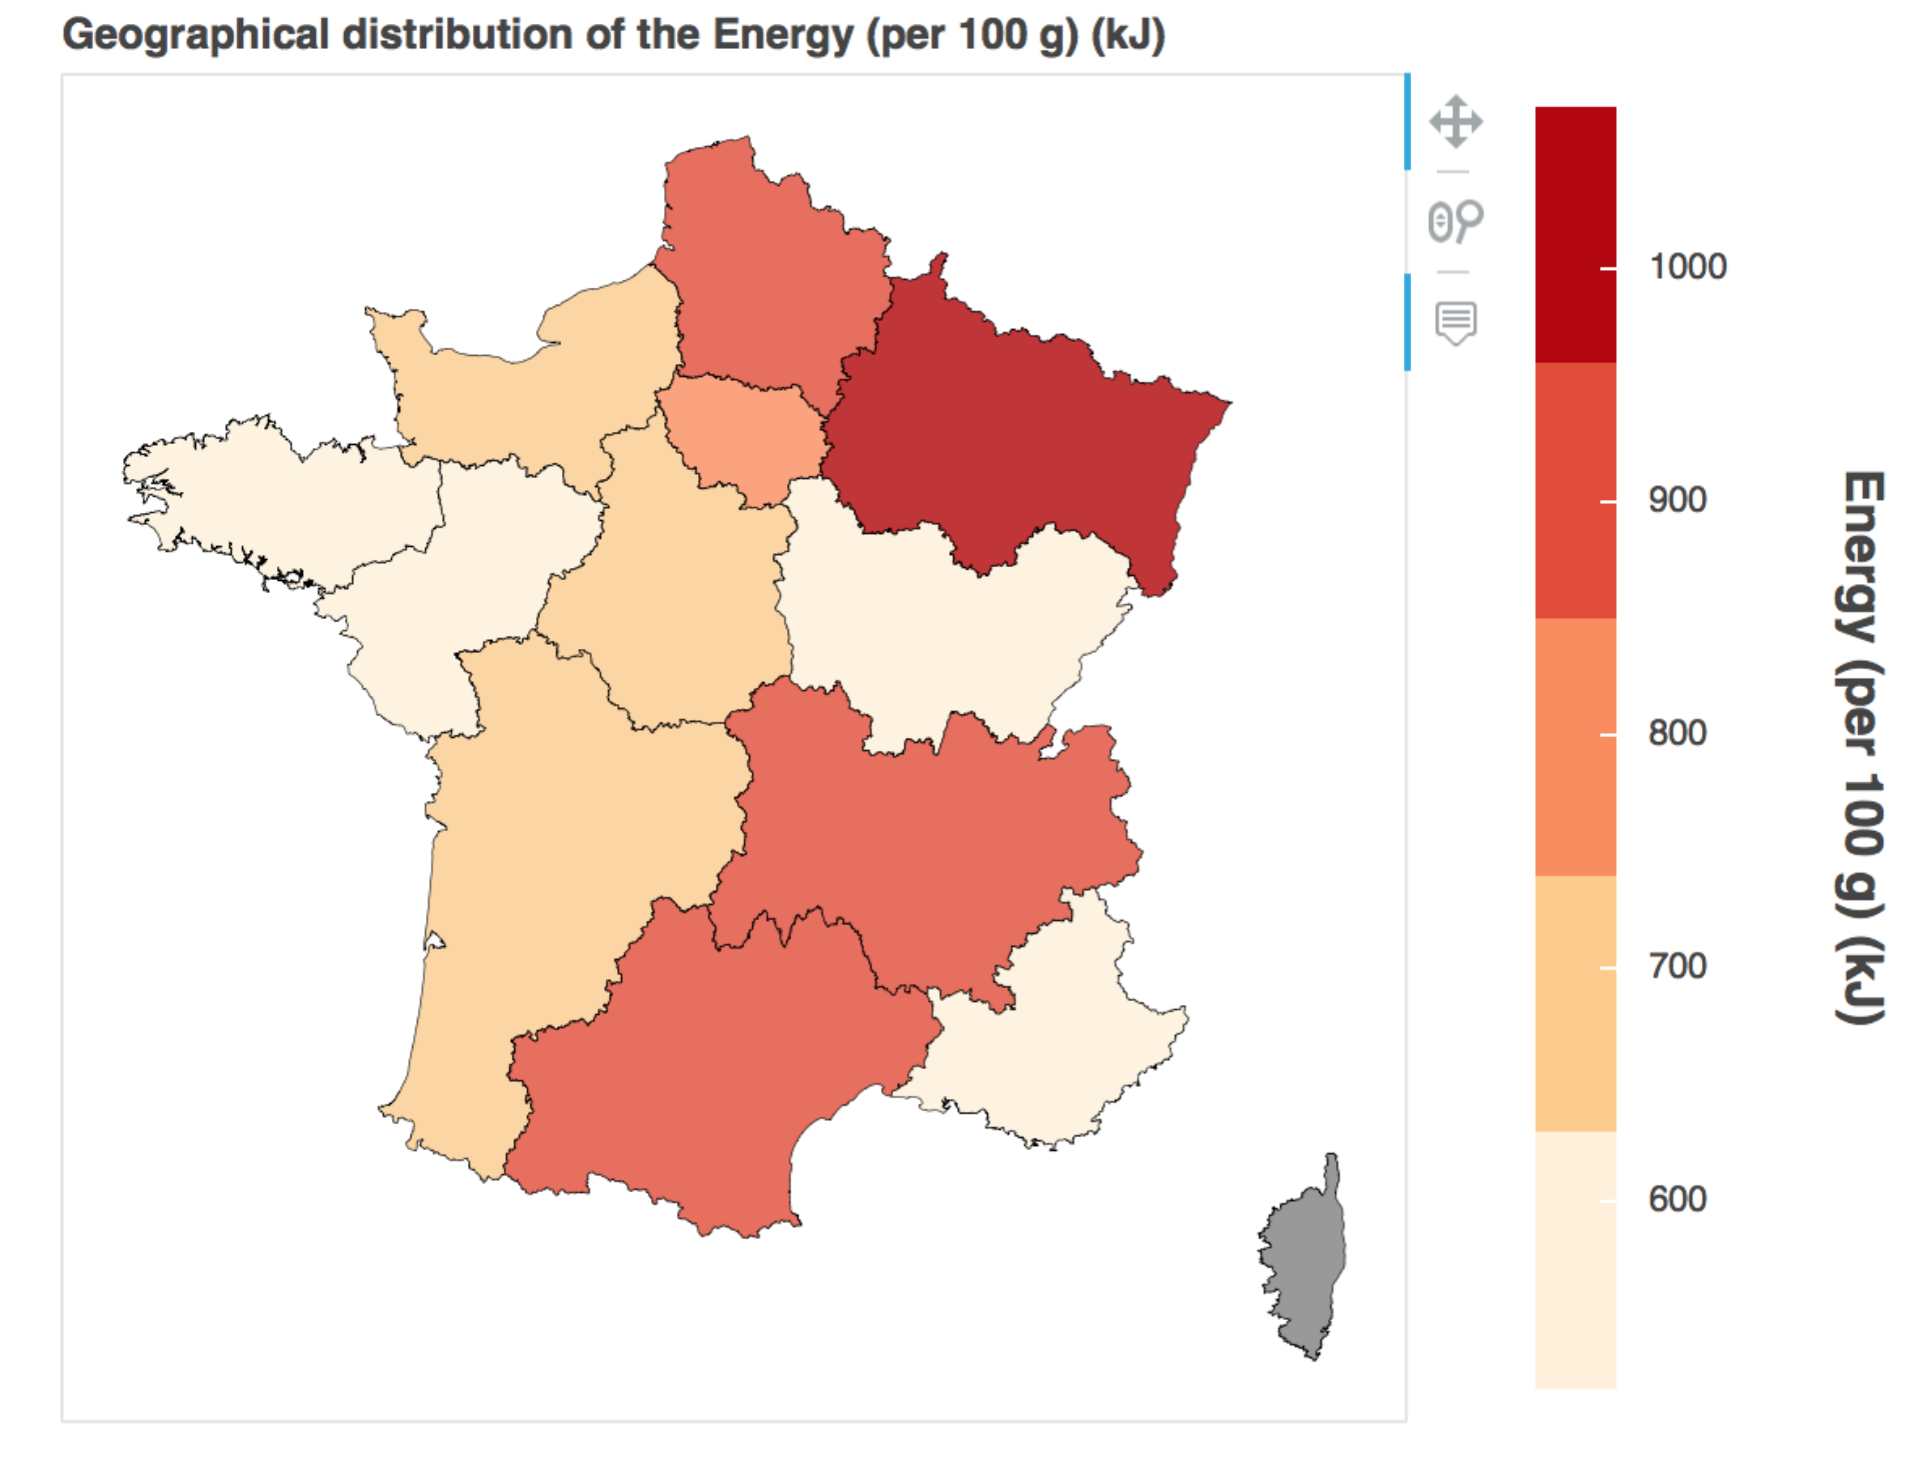
Based on our analysis up to now, we have plotted our data on maps. Each French subdivision contains the median value of the evaluated feature. We have plotted every nutritional and economic feature. However, the only pairs for which we found a correlation significant to the 95% level are:
- Median revenue and calorie density at the region level
- Median revenue and energy at the arrondissement level

Discussion
The goal of this project was to explore the relation between income and food availability in order to find an intermediate link between obesity and poverty. As we have shown, this problem is not without complexity.